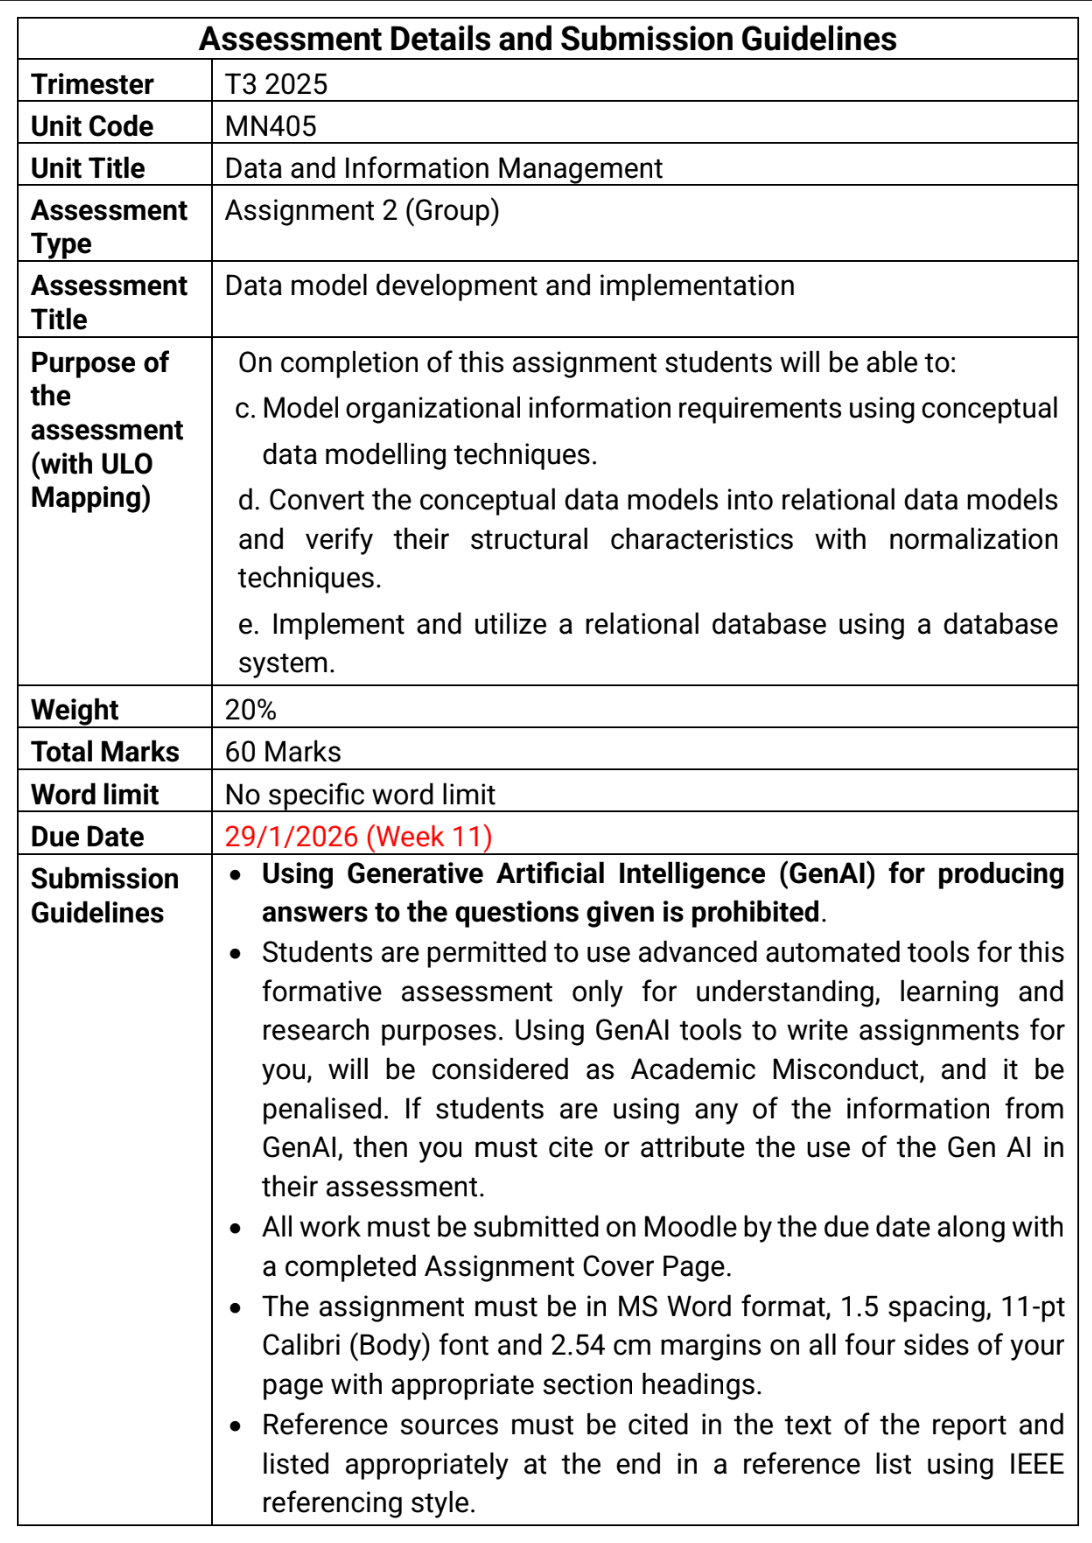
Assignment Description
This is a group assignment. Each group must consist of 3-4 members. This assignment consists of Part A and Part B.
In Part A:you will identify organisational information requirements and create conceptual data model using Entity Relationship diagram (ERD). Then you will implement it by converting conceptual data model into relational data model.
In Part B:In addition to your written report, you should demonstrate your work to your tutor during week 10 or 11 lab classes.
Part A (50 Marks)
You are assigned to design and implement a database for a real estate agency. The real state agency sells two types of properties: apartments and houses. The clients purchase the properties through agent. Your design must fulfill the following business rules:
- • A real estate agent can sell many properties, but each property needs to be sold by one agent.
- • A client can purchase many properties, but each property is purchased by only one client.
- • A client can book an appointment with an agent to view a property. Each property can be booked by multiple clients for viewing, but each property needs to be shown by only one agent.
- • An agent writes a single invoice for each property he/she sells.
- • A client gets an invoice for each property he/she purchases.
Based on the business rules given above, you are required to accomplish the following tasks.
1. Create an Entity Relationship Diagram (ERD) using Crow’s Foot Notation. (15 Marks)
- a. If you make any assumptions about data that are not explicitly given in the problem, these must be described.
- b. You are required to use a software tool to create the ERD. You can use draw.io [1], Lucidchart [2], Visio or any other software tool to create the ER diagram.
2. Mapping ERD to database schema
- a. Analyse the ERD you created in question 1 and list entities.
- b. Add attributes to these entities and represent them as a collection of tables and attributes (Database schema):
E.g. Agent (Agent_ID,................)
Note: Select and underline suitable primary key for each table.
- c. Determine the functional dependences.
- Then normalise these tables. Make the normalization to 3NF. State for every step in the normalization, which functional dependency causes it. (5 Marks)
3. Model building
- a. Build this model using MS Access/ SQLite by creating these tables and Relationships.
- b. Populate these tables with appropriate data; include at least 3 records in each table. Include the following in your MS Word document. (10 Marks)
- I. If you are using MS Access include following screenshots
- ▪ Relationship diagram created in Access. (Select database tools →Relationships in the Access menu)
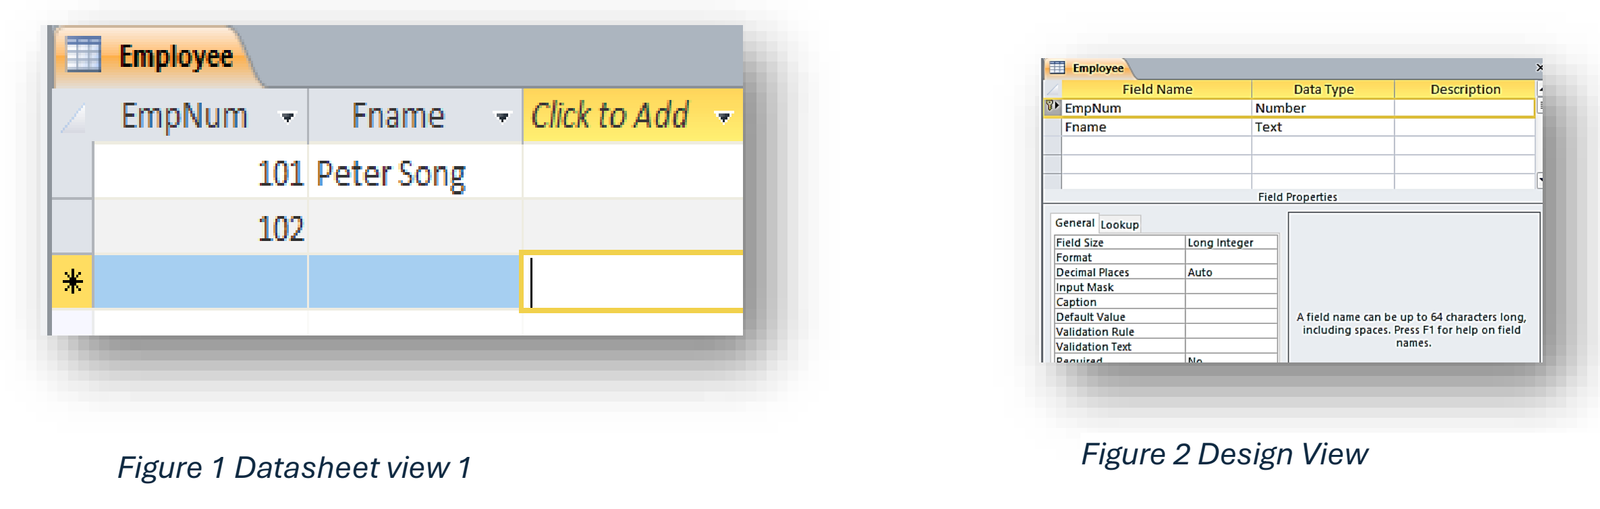
- ▪ Data sheet view and design view of your tables.
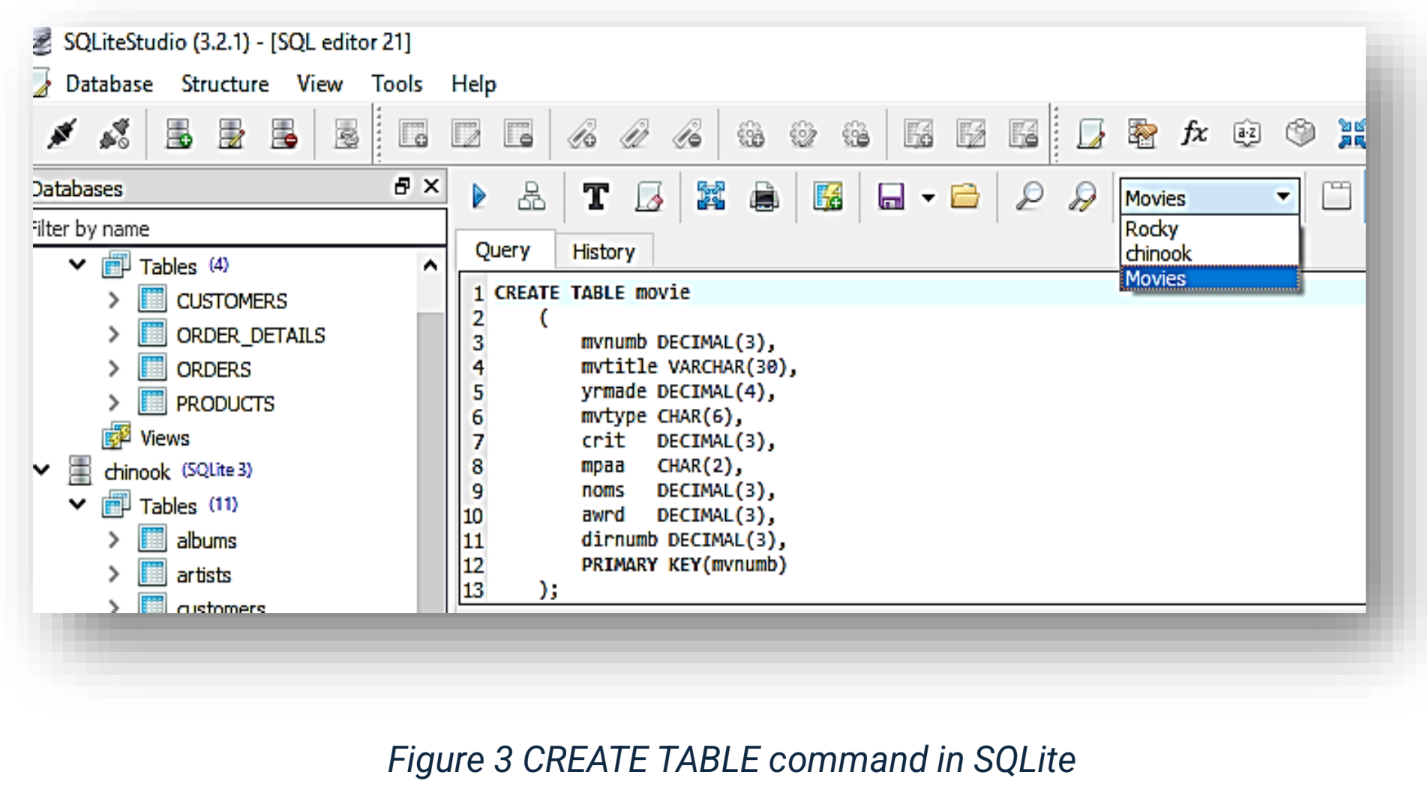
- II. If you are using SQLite
- • Screen shots of CREATE TABLE command and you can use INSERT INTO commands to add records.
4. Report Generation
Write five SQL queries to generate useful information that can be obtained from your database and include the screenshots of the outputs and all SQL statements. Each team member must write at least one query. (10 Marks)
Part B Demonstration (10 Marks)
Project Demonstration
In addition to your written report, you should demonstrate your work to your tutor during week 10 or 11 lab classes. Each team member will present their contribution to the assignment.
This will allow tutors to assess your understanding of skills that are required in your assignment:
- 1. Model organisational information requirements using conceptual data modelling techniques.
- 2. Convert the conceptual data models into relational data models and verify their structural characteristics with normalisation techniques.
- 3. Implement and utilise a relational database using a database system.
You will be evaluated by the lecturer on your ability to perform specific tasks and the products you created as described in the previous section. Your final mark for each assignment will be calculated based on this evaluation.
NOTE:
If you fail to demonstrate the skills required to complete the assignment, you will get zero for the assignment.Bibliography
[1] Draw.io, 2018.
[2] Lucidchart, "ER Diagram Tool," 2018.
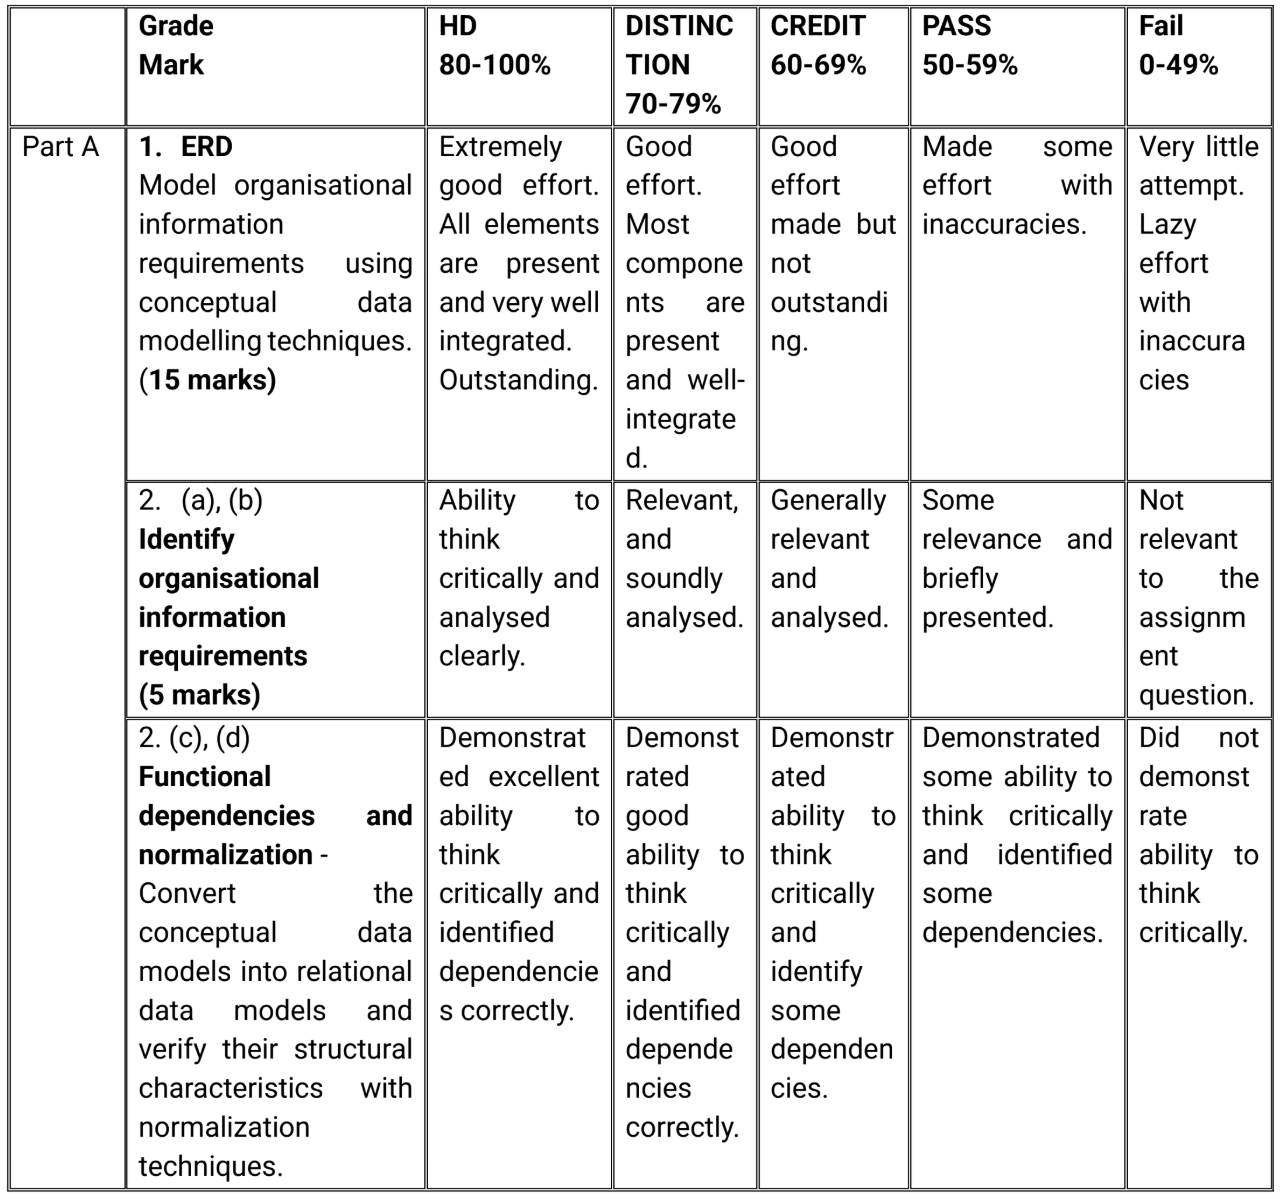
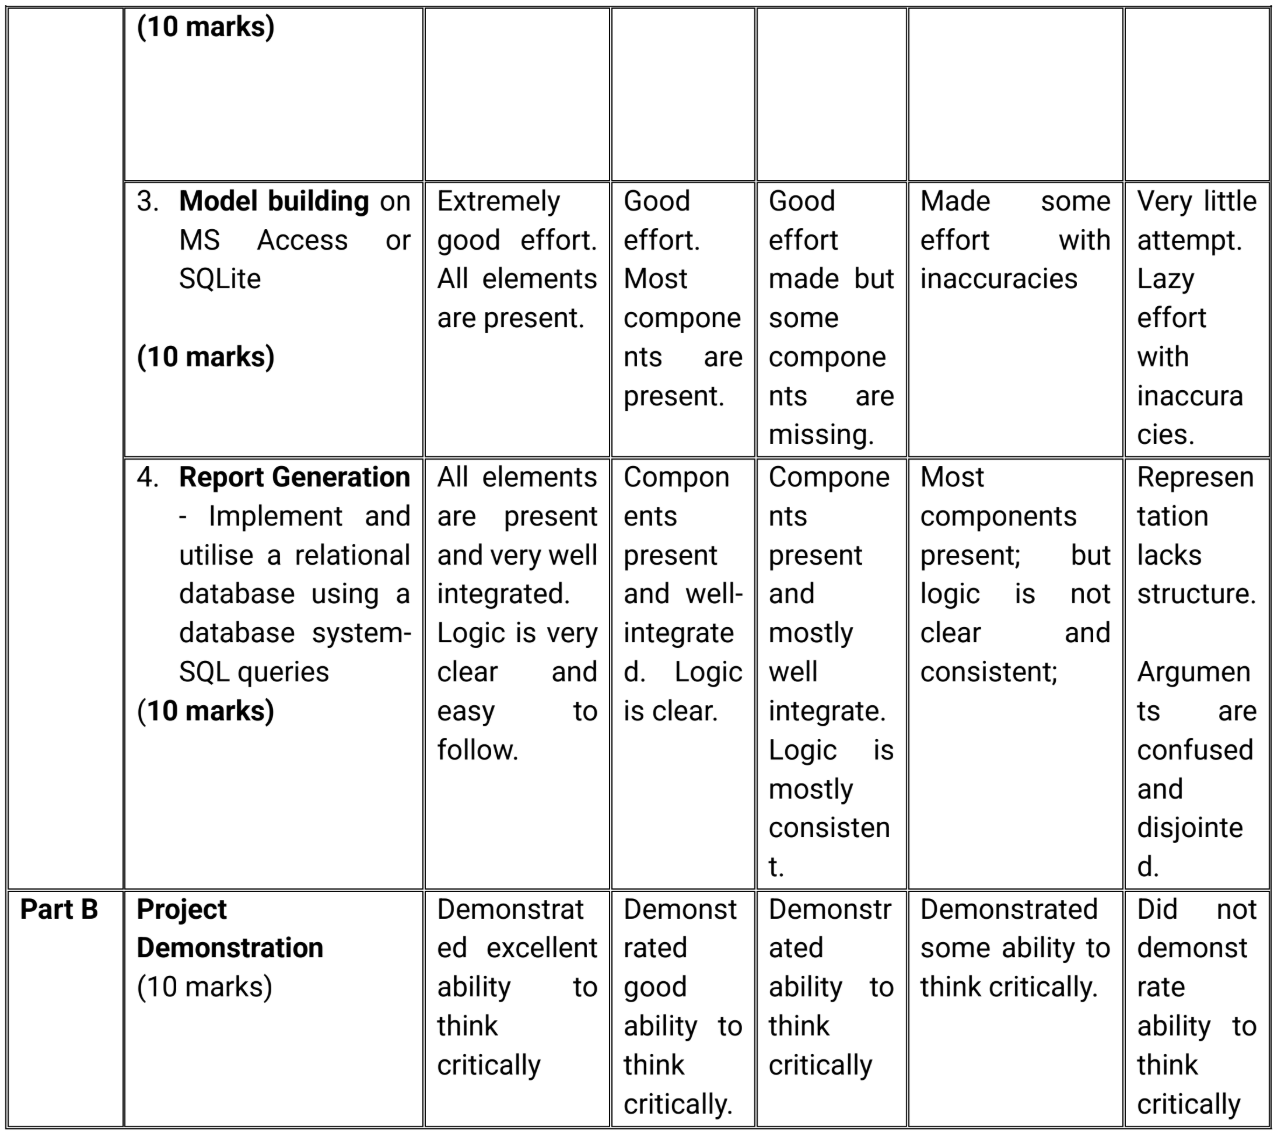
Marking criteria:
Example of marking criteria is shown in the following table. Marks are allocated as follows:
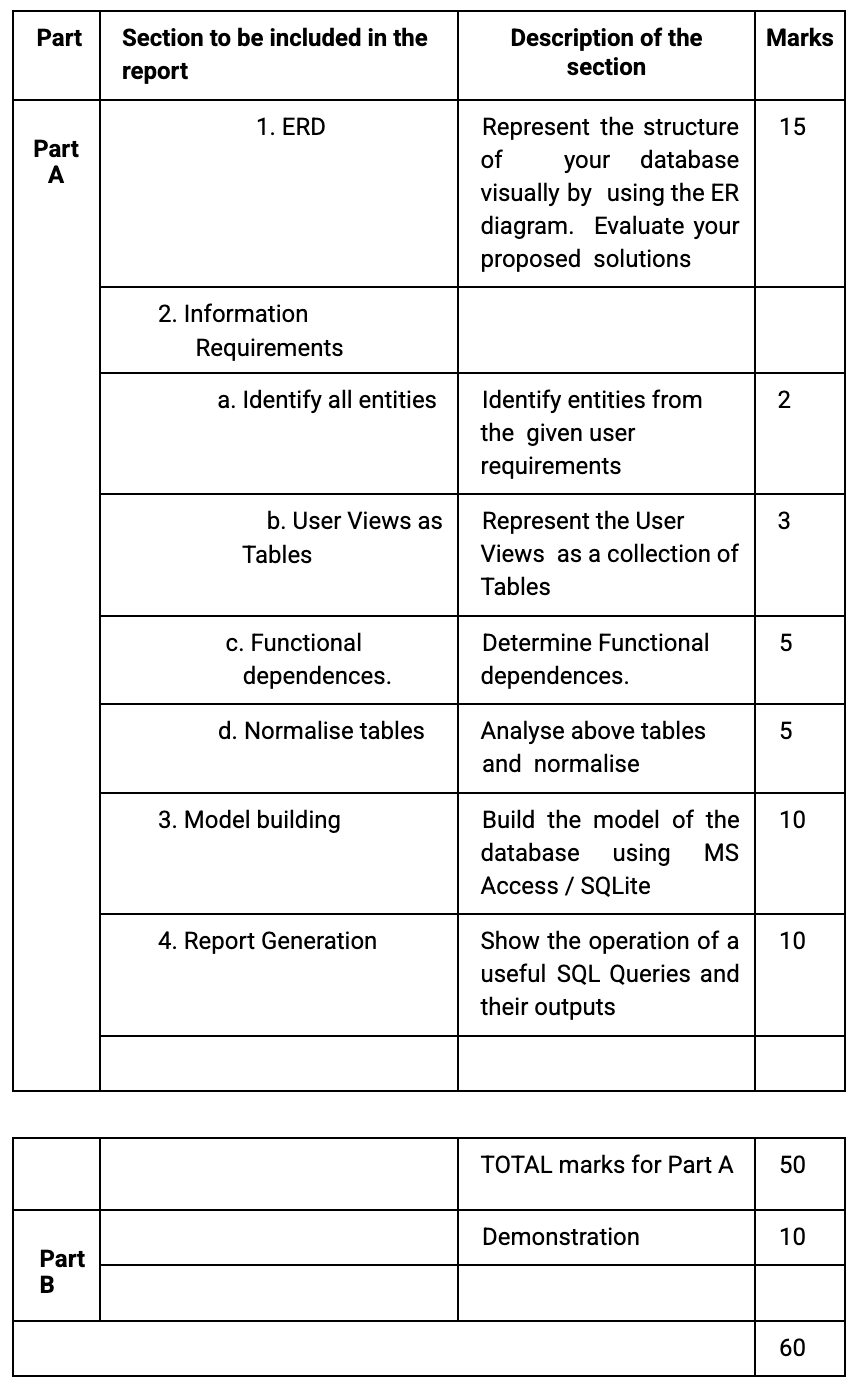
Marking Rubric for Assignment 2 Report