
Please use this document as the cover sheet of for the 1st page of your assessment.
Please complete the below table – the grey columns
By submitting this coursework you agree to all rules and regulations of BPP regarding assessments and awards for programmes.
Please note that by submitting this assessment you are declaring that you are fit to sit this assessment.
BPP University reserves the right to use all submitted work for educational purposes and may request that work be published for a wider audience.
-------Table of Contents--------
- Task 1: Introduction and project plan
- 1.1. Purpose and structure of the report
- 1.2. Project plan
- 1.3. Chosen data analytic framework and its benefits in answering the core business questions
- 1.4. KPIs of Café On The Sea (COTS)
- Task 2: Data preparation quality issues and remedies
- 2.1. Generic data problems, techniques for identifying and mitigating them
- 2.2. List of data problems identified in the COTS data set and proposal for addressing them
- Task 3: Data analysis and commentary
- Table A: Sales volume and value by month, by year for 3 years
- Table B: Benchmark comparisons of product groups' performance
- Table C: Benchmark comparisons of sales volume and value between coffee shops by quarter
- Task 4: Data visualisation and commentary
- Chart A: Comparison of sales value trends across coffee shops over time
- Chart B: Product category performance comparisons between coffee shops
- Chart C: Impact of the home-delivery service offered in the Blackpool area, and in comparison with the other two cities
- Task 5: Conclusions and recommendations
- 5.1. Conclusion for COTS sales performance
- 5.2. Recommendations for the CEO and top management of COTS
- 5.3. Suggestions for using data analytics in a better way
- Reference list
Task 1: Introduction and project plan
1.1. Purpose and structure of the report
The report aims to evaluate the sales performance of “Café On The Sea” or COTS, depending on the data set for the sales and performance of the cafe chain across its different outlets. It eventually strives for contributing to the development of decisions driven by data analytics of COTS to identify the outlet with the best performance along with products with the highest potential. COTS is a British cafe chain that operates across different locations in the country. The company owns 15 different outlets in the seaside cities of the UK and it envisions giving the customers a feeling same to that of the cafes of Italy and France. In this project, a descriptive data analytics framework has been applied to evaluate the performance of COTS and its outlets over the years through data commentary and data visualisation. The structure of the project includes an introduction to the overall discussion, an exploration of the quality issues of data preparation and their remedies, analysing of the data through commentary, commentary through visualisation of the data and finally the conclusion of the overall findings and recommend better strategies to the top management of COTS.
1.2. Project plan
The project plans for delivering its objectives using a data analytics framework for analysing and evaluating the data related to the performance of COTS. in the case of this project, the data was already collected. Hence, the further stages for delivering the project include sorting out the data, which helps in analysing and evaluating them with efficiency (Alvarez, Ishizaka and Martinez, 2021). Additionally, the next step for the project involves the analysis of the data using MS Excel software. Eventually, the analysed results are interpreted and commentary is developed using the findings. Overall, the project is carried out using a strategic analytical approach to sort, analyse and interpret the data sets, and it is expected from the final outcome to be helpful in answering the core business question.
1.3. Chosen data analytic framework and its benefits in answering the core business questions
The study applies a descriptive data analytics framework for analysing the data regarding the business performance of COTS. According to Cote (2021), descriptive analytics is one of the simplest yet most effective data analytics frameworks. It allows businesses to visualise and interpret a set of data to understand the key trends of the businesses. The application of this framework is likely to explicitly refer to the preliminary focus of the study and answer the questions related to the core business question related to the sales performance of COTS.
1.4. KPIs of Café On The Sea (COTS)
In terms of the KPIs or “Key Performance Indicators” for COTS, it has been found that the company strives for improving its sales, along with increasing the value of its business. Moreover, the company also focuses on the cost-efficiency of its operations, one of which is its procurement operations. Depending on these focuses of COTS, the KPIs of the company can be illustrated as follows:
- ● Revenue earned by the company.
- ● Customer satisfaction level.
- ● Sales performance of different cafes and different products.
- ● Operational cost in procurement management.
- ● Profitability and revenue earned by different cafes.
Evaluation of these performance indicators can be helpful for COTS to identify the efficiency and contribution of its different outlets on the organisational strategic endeavours. On the other hand, it can be helpful in identifying the outlets and the products that have the highest contribution by facilitating the process of performance comparison. Additionally, the identification of sales trends and functionality of the new strategies, like home delivery, can also be facilitated by the evaluation of the KPIs.
Task 2: Data preparation quality issues and remedies
2.1. Generic data problems, techniques for identifying and mitigating them
Data analytics has become largely valuable for business professionals such as managers, operational professionals, marketing professionals and more. It allows them to make trend predictions, evaluate business performance, identify loopholes and eventually promote the performance functionality (Tabesh, Mousavidin and Hasani, 2019). However, there are some generic data issues that are encountered by professionals. Some of the data problems include duplicate data, hidden data, inconsistent data, large amounts of information and more. To be specific about the issue of duplicate data, businesses strive to gather data from a broad range of sources, which increases the chances of data overlapping and duplication, which might lead to wrong interpretation using the data (Argaw et al., 2020). On the other hand, inconsistency in the data, due to the source authenticity issues, and more can be implicative for generating the wrong predictions of business trends. In order to avoid the implications of the data problem, the data analysts must work for identifying the issues (Oleribe et al., 2019). To be specific, they should work for detecting the overlaps by running an overlap analysis. Additionally, inconsistency can be identified by capturing the patterns can be helpful in detecting errors or inconsistencies. Along with identifying the problems and inconsistencies, the data analysts must incorporate data quality control measures, follow a specific and consistent process map for analysing data and more (Sharma et al., 2019). It can also promote the capabilities of the company to deal with a high quantity of information. Overall, it can be said that the adoption of proactive strategies to identify and mitigate data problems can promote the efficiency and trustworthiness of the data analysis outcomes.
2.2. List of data problems identified in the COTS data set and proposal for addressing them
In the case of the data set provided for COTS, one of the most significant data issues that the company is likely to face is difficulty in handling too much information. To be specific, handling a large quantity of information can challenge the data analyst in prolonging the time and effort to be put into the data analysis process, as it may make it difficult for the data analyst to handle the information and analyse them (Madley-Dowd et al., 2019). Additionally, the data set also notifies multiple inconsistencies. To be specific, in the case of the year, the data set is not consistent and does not follow a chronological order for listing the information regarding the sales performance of different outlets of the cafe. Moreover, the data provided in the data set are for the years, 2020, 2021, 2022 and 2032. It seems to be a typing error, as it is not possible for COTS to predict its sales of 2032, 10 years in advance. Even though the issue of inconsistency can be mitigated by sorting out the data, there is a high chance of error due to the quantity of information (Cao, Lu and Wen, 2019). Additionally, the data analyst team should work for integrating an inconsistency capture framework, along with quality control measures for mitigating the issues that may undermine data analysis quality.
Task 3: Data analysis and commentary
Table A: Sales volume and value by month, by year for 3 years
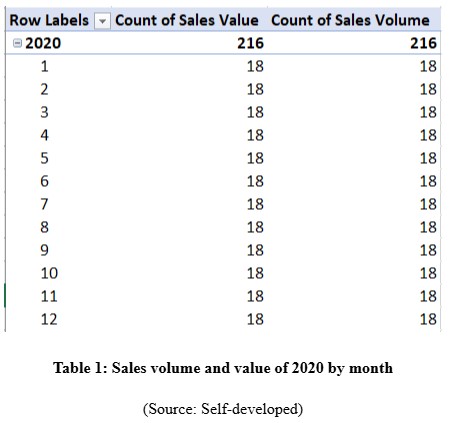
Table 1 demonstrates the sales volume and value of 2020, 2021 and 2022. As illustrated in the table, the sales volume of 2020 and 2021 are the same, that is, 216. Additionally, in the case of 2022, the sales have decreased significantly. From these findings the following interpretations can be made:
- ● The sales value and volume are interrelated for cafe chains like COTS (Proença et al., 2022).
- ● The reduced volume of sales implies a gap in the organisational efficiency to retain or increase customers.
- ● The lack of customer retention and expansion competencies suggests that the business is likely to deal with a gap in organisational sustainability and competitiveness (Azeem et al., 2021).
- ● Depending on the above interpretations, COTS can be suggested to improve its performance and customer relationships to sustain sales and the value of the company.
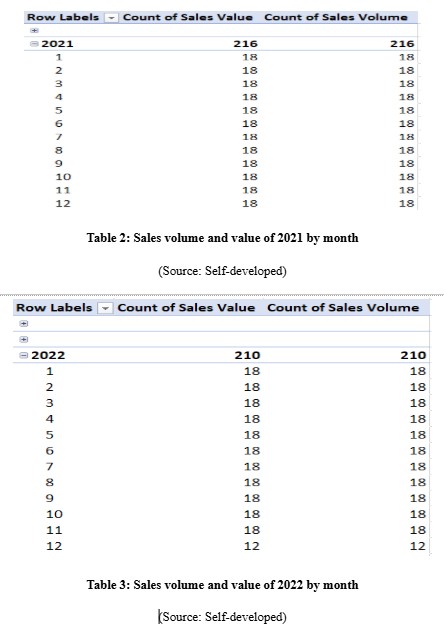
Table B: Benchmark comparisons of product groups' performance
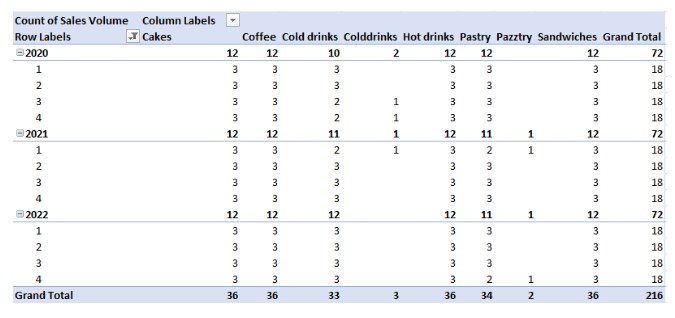
Table 4: Comparison of product groups' performance by quarter and months from 2020 to 2022
Table 4 demonstrates the values for different products sold by COTS by year and quarter from 2020 to 2022. It includes information regarding the sales of cakes, coffee, hot drinks, cold drinks, pastry, sandwiches and more. As found from the results, coffee, cold drinks, cakes, hot drinks and sandwiches have been sold in the highest amount. At the same time, “pazztry” has been sold in the least amount for the last three years. Overall, the table can be interpreted as follows:
- ● COTS should focus on maintaining the quality of the products with the highest sales volume as they are the primary contributors to the organisational revenue earned.
- ● Further improving the product quality can promote customers’ satisfaction with the products and increase sales of the products at COTS (Suhud et al., 2020).
- ● COTS should remove the products with the least sales as they are not preferred by the customers (Goli et al., 2019). For instance, sales of 3 “pazztry” over three years demonstrate the inefficiency of the product to be preferred by the customers. Hence, COTS should remove this item and other such items that have failed to impress customers from their menu. Depending on the conceptualisations of Li et al. (2021), it can promote procurement cost and efficiency of the cafe.
Table 5: Comparison of sales level and value between coffee shops by quarter and year
Table 5 shows a comparison between the sales volumes of different coffee shops across the years from 2020 to 2022. The results show that the stores in Blackpool, Portsmouth and Southampton. The table demonstrates the sales of different cities, across the quarters of the three years. The results show that the sales volume in different locations over the years has been the same. From these results, the following inferences can be made:
- ● The sales volume of all the cities is the same, which implied the consistency of COTS’s performance across different locations.● Depending on the discussion of Pronti and Coccia (2021), it can be said that the company has shown resilient performance in managing customers at different locations.
- ● Depending on the discussion of Pronti and Coccia (2021), it can be said that the company has shown resilient performance in managing customers at different locations.
Task 4: Data visualisation and commentary
Chart A: Comparison of sales value trends across coffee shops over time
Figure 1 demonstrates the sales value of different shops across the years from 2020 to 2022. It shows that the sales in 2020 and 2021 were consistent, while sales decreased in 2022 in Southampton. Even though the decrease was not much significant, the failure of the company in increasing its sales reflects the lack of competitiveness of the company. Hence, the following can be interpreted:
- ● COTS should work on promoting itself and sustaining its performance.
- ● It must work for increasing the customer base and improving its performance outcomes.
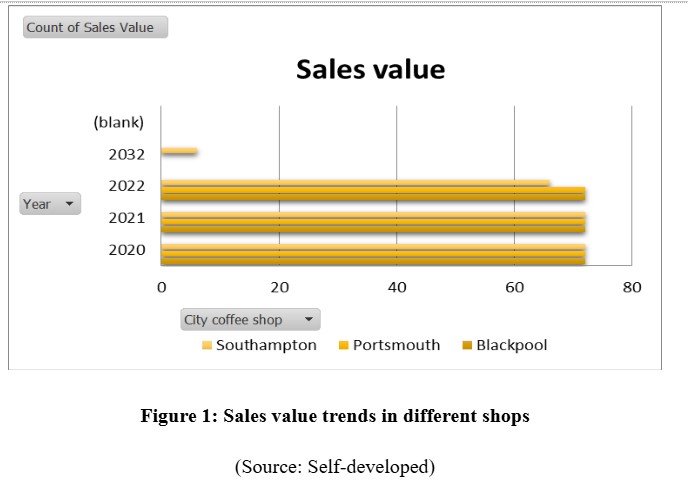
Chart B: Product category performance comparisons between coffee shops
Figure 2 shows the sales value of different product categories of COTS in different coffee shops. As a result, it has been found that “colddrinks”, “pazztry” and sandwiches have the least sales in every outlet during the last three years. The findings from the chart can be interpreted as follows:
- ● The company should reduce its product portfolio by cutting off the least sold items.
- ● It can contribute to better customer and procurement management.
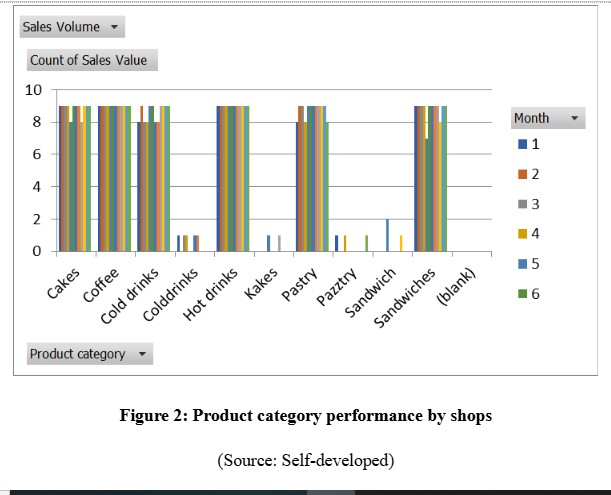
Chart C: Impact of the home-delivery service offered in the Blackpool area, and in comparison with the other two cities
The chart shows the performance of COTS’s newly introduced home-delivery services in Blackpool along with the other two cities. The results can be interpreted as follows:
- ● The value contribution of Blackpool is better than the other two cities.
- ● Southampton and Portsmouth should introduce home delivery services.

Task 5: Conclusions and recommendations
5.1. Conclusion for COTS sales performance
Conclusively, it can be said that COTS shows resilient performance across different locations. Additionally, it has also been found that the company has shown consistent performance in the first two years, that is 2020 and 2021. At the same time, the sales volume has decreased in 2022, which has affected the value and organisational income as well. It implied that COTS lack consistency in retaining costumes or increasing its customer base. Even though the performance was consistent in 2020 and 2021, it did not improve, which implies stagnancy of the business in growing itself. Hence, COTS should come up with effective strategies to increase its customer base and retain them by improving the quality f the product and services delivered to them. Additionally, the evaluation has suggested that some of the products are not in demand in the last 3 years. It suggests the need for the company to cut them off from the menu and focus on the quality of existing products to enhance customer satisfaction. Additionally, the performance review has also suggested that the introduction of home delivery services at Blackpool is more beneficial for increasing the value earned in this city, in comparison to the other two cities.
5.2. Recommendations for the CEO and top management of COTS
As per the findings of the study, it can be said that the CEO and top management of COTS should focus on the following suggestions for improving its performance:
- ● Cutting off products from its menu:COTS should cut off items from its menu that have the least demand. It can be helpful for the company in narrowing down its focus along with promoting the efficiency of its procurement management activities (Küpper, 2022).
- ● Focusing on product innovation and quality promotion:Innovation and quality management are interrelated that eventually contribute to the optimisation of the quality of services at organisations, especially in restaurants. Hence, it can be said that COTS should promote innovation in its product quality management practices. It can contribute to improved customer management (Banker, et al., 2021).
- ● Introducing home delivery services to Portsmouth and Southampton:The home delivery services have been helpful for COTS in promoting sales value, which indicates that introducing the same in other locations to be helpful for COTS to increase the overall sales value of its business across different locations (Tesha, 2020).
5.3. Suggestions for using data analytics in a better way
In the case of data analytics, the company should work on reducing errors and increasing the consistency of the data. Moreover, the company should integrate its data collection and analysis capabilities to promote its efficiency in predicting sales and performance.